
Supercharge the Created vs Resolved Gadget!

The Tip of the Month, brought to you by Atlassian University, is a monthly series to help master Atlassian tools. Products are more fun to use when you know all the tricks.
Hey Jira Mavens! It’s time for another tip from Atlassian University. Almost everyone on the project team has the question, “How are things going?” Looking sprint to sprint it’s easy to see progress at the sprint level but what if you want to take a step up and see the larger picture?
Measuring Progress
Every project has flow. Flow is the change in the number of open issues over time. How many issues, work items, and other requests are coming into my project? Are we making progress to our goal or just treading water? Or, are we losing ground? Knowledge is power and Jira can easily tell you how you are doing.
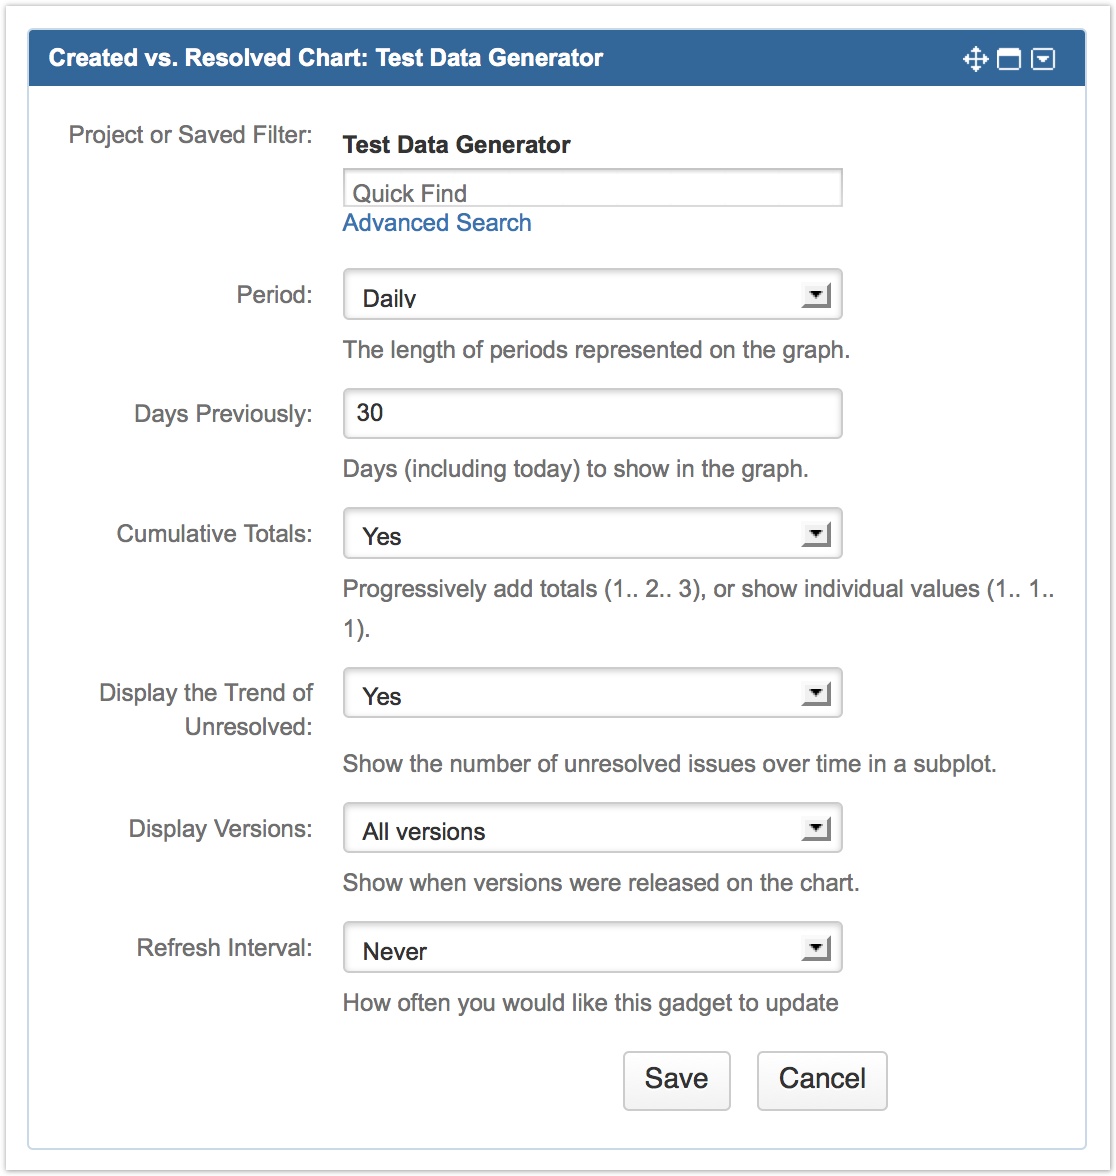
Meet the Created vs Resolved gadget. It was included with Jira 4.0, and still packs a lot of power in terms of data visualization. It shows up on a product’s home page, but you can also add it to the system or a custom dashboard. Most gadgets in Jira have a simple interface to pull data. You can use an entire project of a filter. Using the project filter is an easy way to get started. The gadget has several options:
To use this gadget:
- Log into Jira. You will be on the system dashboard.
- Click tools, create new dashboard. You can take the defaults once you name your dashboard.
- Add the created vs resolved gadget
- Type in the name of a project that has been active lately.
- Create the gadget.
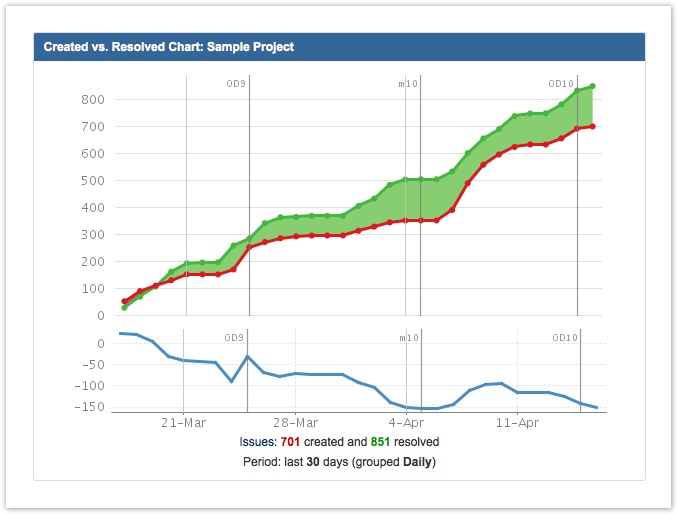
You should see the gadget load on the dashboard with a mix of red and green.

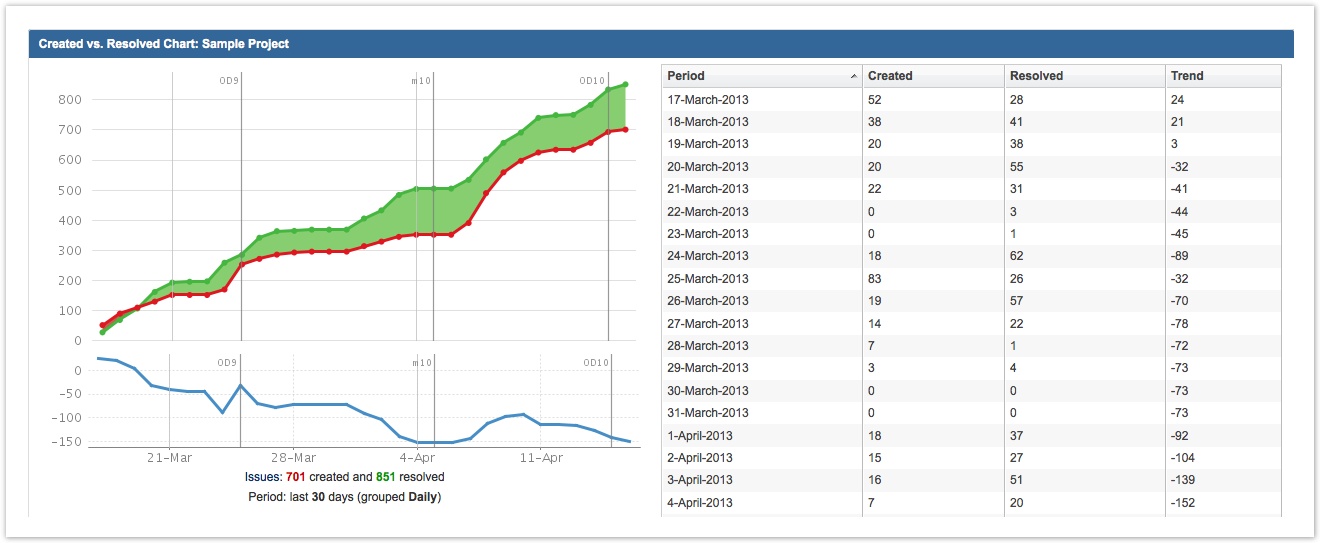
If the red line is higher, more issues are coming into the project than are getting resolved: you are losing ground. If the green line is higher, you are gaining ground; more issues are getting resolved than being created. The blue line at the bottom shows the change in resolved issues over time. Showing the blue line is an option in the gadget configuration. This team is making good progress in resolving their issues. If you click the expand icon you can see detailed metrics of the project.
Moving beyond the project filter
While entire project metrics are interesting, you can do a lot more with this gadget. When used in conjunction with a filter the created vs resolved gadget can really highlight inportant metrics. I use JQL based filters, but you can create filters with simple search as well.
Q: What if we wanted to only see the flow rate of bugs?
A: Create a filter with JQL “Project in (Project1, Project2) and type = bug”
Q: How can I see my own flow rate?
A: Create a filter with JQL “assignee was currentuser()”
Q: How is my service desk resolving issues that were filed today?
A: Set the time range on the gadget to hourly and use the JQL query “created > -1d”
For each of these examples you will need to create a filter first and then select the filter when enabling the gadget. To learn more about creating filters, take a look at lesson 3 in our JQL series.
Want to learn more? Sign up for the Jira insider’s email today!
If you found this helpful, please visit Atlassian University – interactive tutorials and videos with tons of tips just like this one.