
I’m excited! Back when I talked about Satisfying the Customers of BuildEng team I talked about ensuring that we communicate to our customers that we’ve seen the issues that they have created by Triaging those issues quickly. This is really important, it provides our customers quick feedback on the issue that they have raised so they don’t feel that it has fallen into a dark hole that no one is watching.
During the triage process we set their expectations on whether the team has committed to working on the issue soon (Status = Backlog) or that no commitment has been made to work on the issue in the near future (Status = Triaged).
The Disturbed
Back in October the BuildEng team introduced The Disturbed.
A volunteer, team hero, works as The Disturbed TM every 1 week. Each week, a new hero.
The Essential Responsibilities of The Disturbed are:
- Monitor our “Build Engineering” channel on Hipchat
- Answer adhoc queries that come through from other teams
- Monitor our “Build Engineering Alerts” channel on Hipchat. Alerts for the following events are chatted:
- Untriaged issues or issues missing a Component
- Infrastructure labels applied to builds – Ensuring a BUILDENG issue is raised for each occurrence & comment is added to the build to notify the customer that the problem is being addressed
Triaging incoming issues:
- To the Backlog!
- Faults (verified)
- Tasks for immediate action
- To the Triaged!
- Everything else
- Handle small, quick issues / queries
- Timebox it!
- Max time ~1h for each task if you’ve got multiple requests to handle
- Try to remember to add yourself as a watcher to an issue if you hand it off
- Monitor Agent Smith for all Bamboo instances
- Take appropriate action when required
- Pair with someone from the team if you need help / unfamiliar task – the rest of the team is expecting you to ask them!
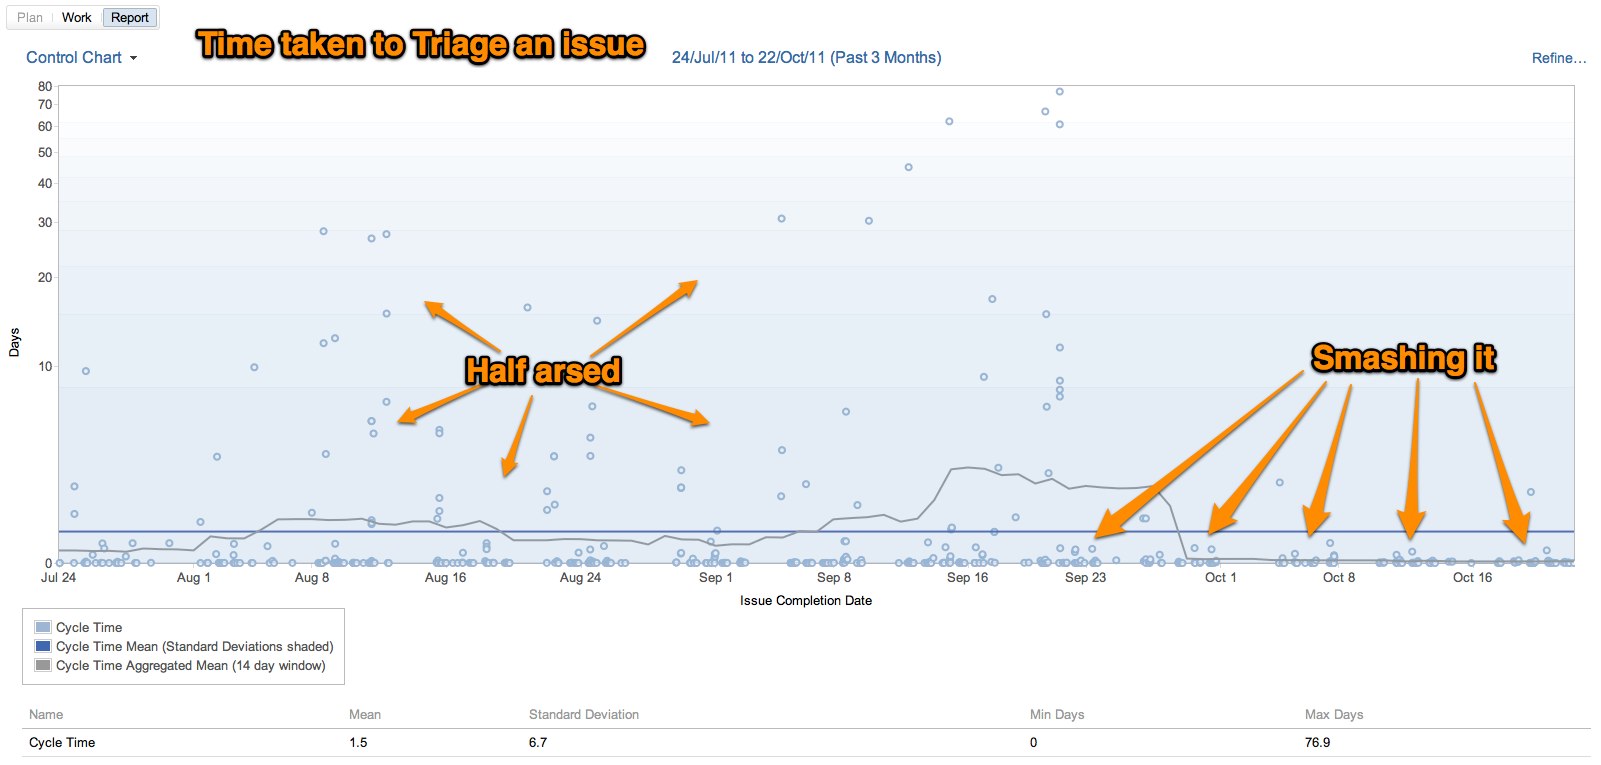
Impact of The Disturbed
Within one month of introducing The Disturbed we saw a marked improvement in the time taken to triage issues.
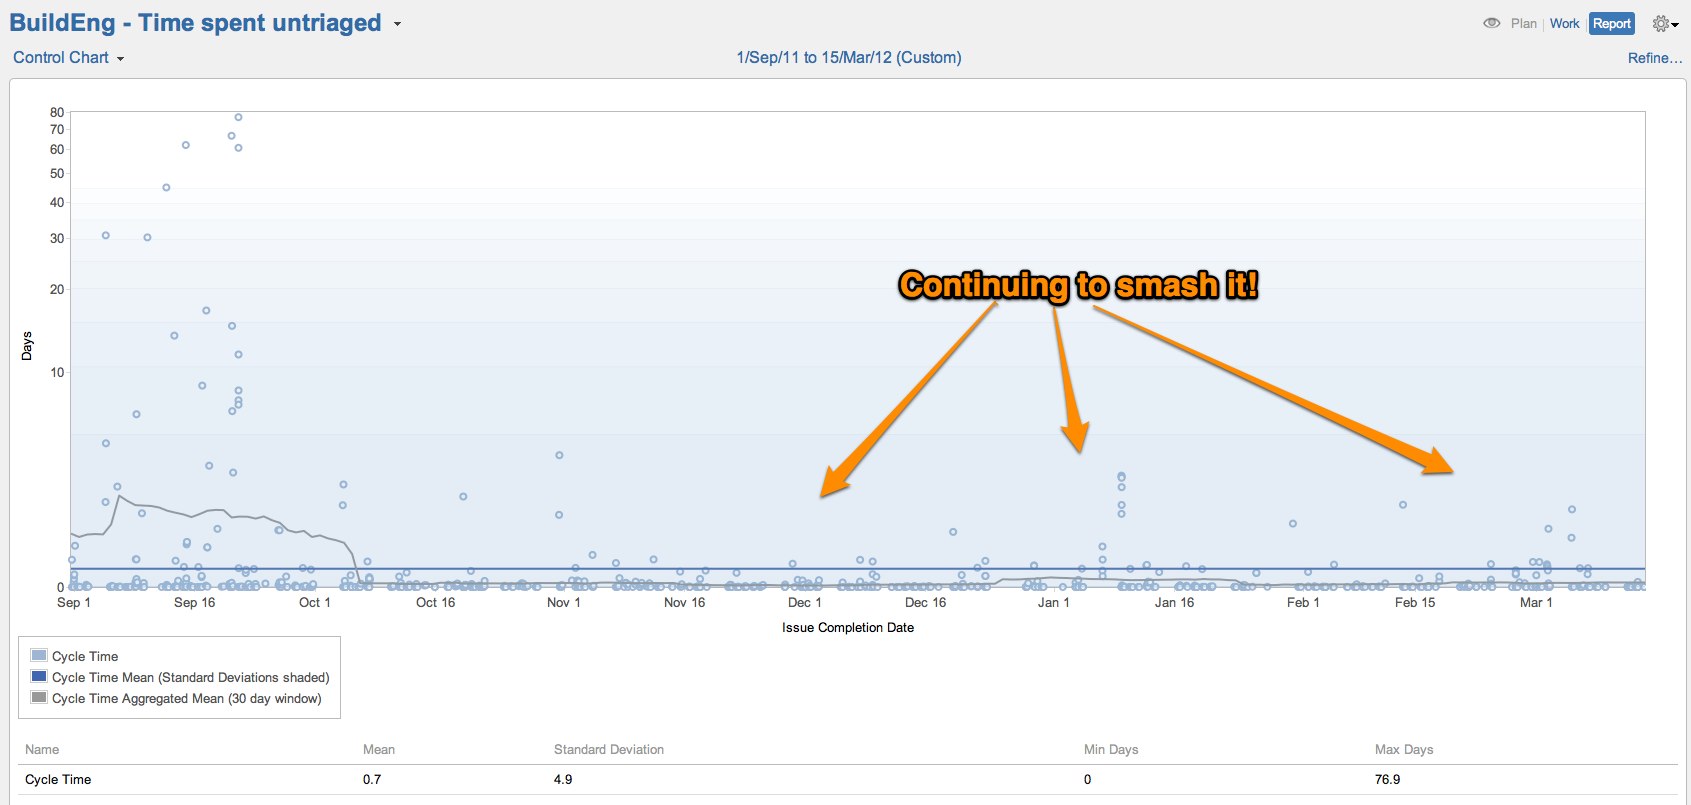
I’m happy to say that the trend of triaging issues is continuing, this is a chart for the past few months:
Limiting Work In Progress
What I’m really excited about though is the following control graph. It shows how much time it takes from when the time the team commits to working on an issue (Status = Backlog) to it getting it done (Status = Done):
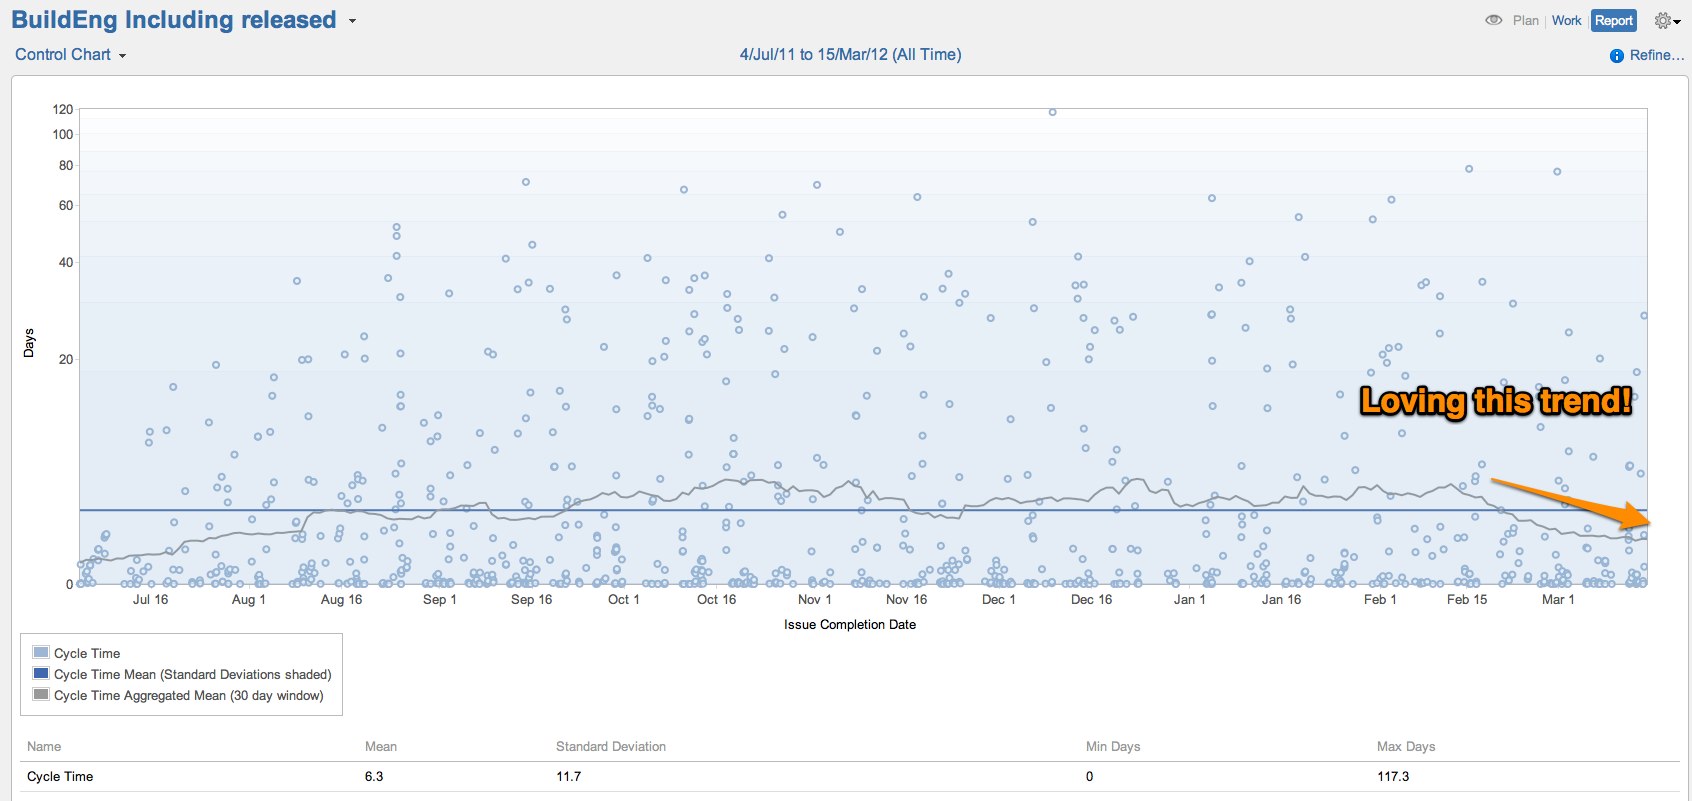
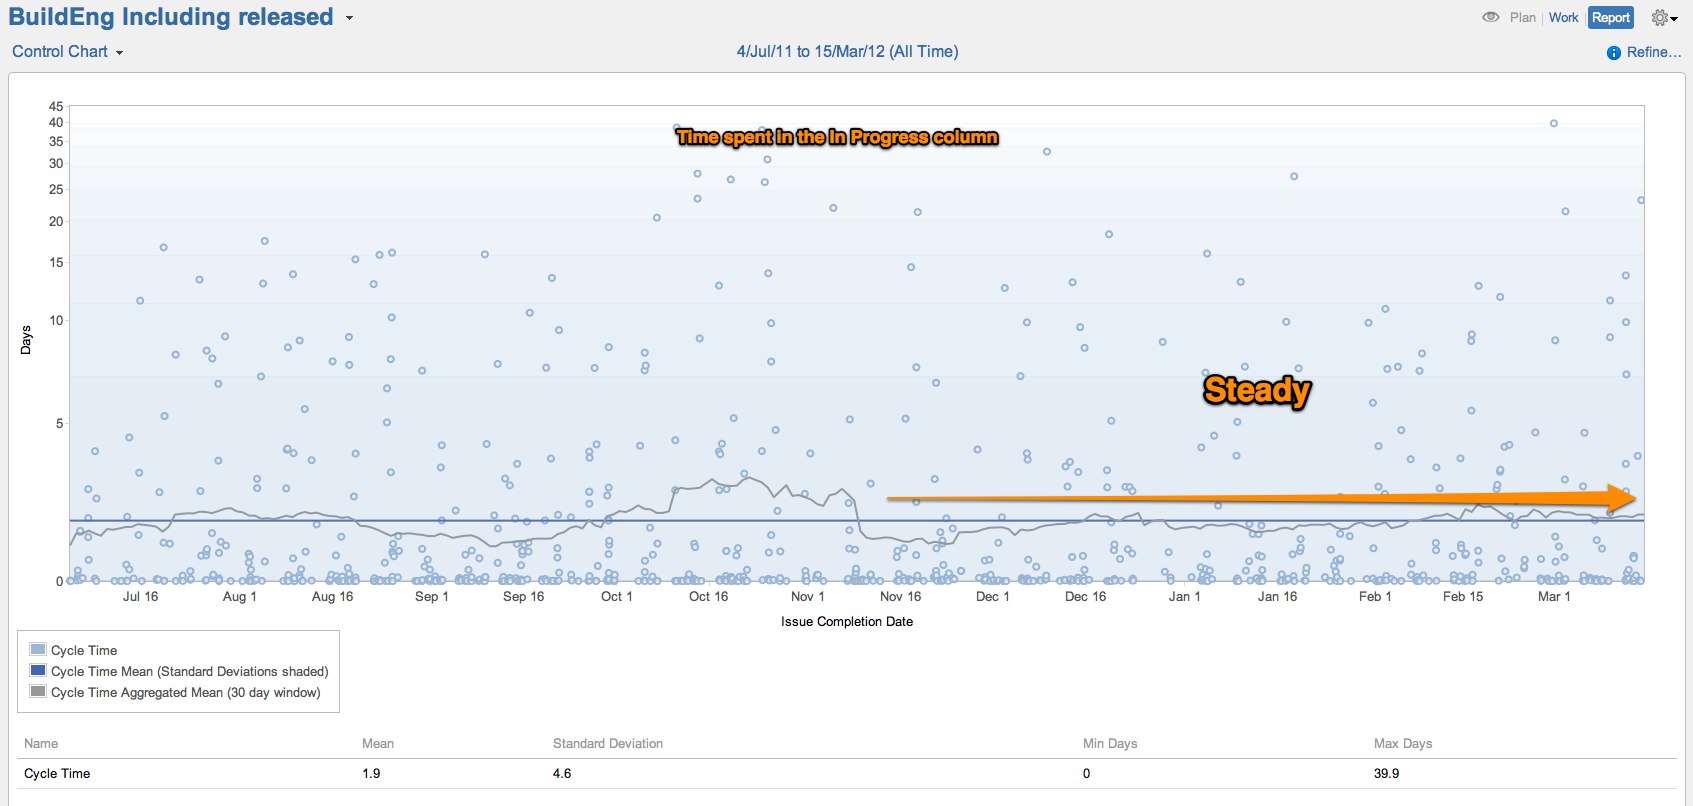
What this graph shows is that the average time spent in Backlog & In Progress has been decreasing in the past couple of months. Breaking it down into individual statuses we can see that:
Backlog – we can see that the improvement has been in the time spent in the backlog

In Progress – we can see that the average time spent to complete a task is steady
It has been a combination of reducing the limit of the Backlog column (currently set to 15), remaining discipled about the limit and pulling the issues that have been sitting in the Backlog column the longest. The dots on each card for the days spent in this status really helps here:
I’m loving this. Not only does limiting our WIP provide a sense of focus of what we’re working on. It provides a sense of predictability to our customers, and allows us to react to changes in direction or requirements more quickly.