You can use Jira to see what’s happened in the past, view today’s work in a whole new light, and to frame important decisions as you plan for the future. Take advantage of searching the change history of issues in your Jira instance to discover all kinds of new insight into the flow of work in your organization. The longer you’ve been using Jira, the more gold is in there for you to discover!
Let’s take a look at some examples.
Search for Training Needs
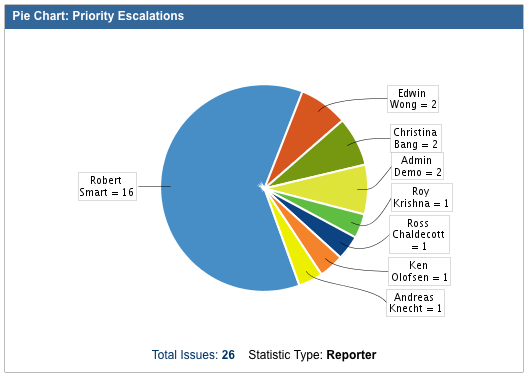
A key indication that the Reporter and Assignee of an issue aren’t on the same page is when a bug or task is escalated in Priority. A misunderstanding about what is important to the health of a software project can have consequences: work doesn’t get done in a timely manner, or vital items fall through the cracks. Insight into changing priorities can tell you a lot about how your team operates today, how things have changed over time, and what you should do in the future to keep projects rolling along smoothly.
Paul, the development team lead, sets aside an hour a week for bug triage, and editing priority is a normal part of the process. Paul would like to reduce the time he spends cleaning up bug reports so he can focus on more important tasks.
 Paul pulls a search for all issues in this project that were escalated in priority and sorts them by Reporter. He can quickly see that Robert, a QA engineer, is the reporter of the majority of bugs that are escalated in priority. Giving Robert an overview of how to set priorities properly on bugs – which might be as simple as letting Robert sit in on bug triage a few times – can save Paul 5 or 10 minutes of time each week.
Historical Risks & Knowledge Gaps
When work is delayed by days or even weeks, it might change your release date or affect other parts of the project in negative ways. Changing the order in which you complete work is natural for many software teams, and Jira enables you to analyze what types of work are pushed back most often.
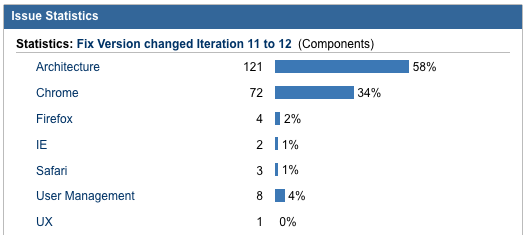
Paul knows that the performance team has gone through a lot of hiccups after the team added some new page views in a recent iteration. He pulls a search for all issues that were carried over from iteration 11 to iteration 12, and reviews those by Component.
He can see that many of the issues pushed back related to one specific browser. He will use this information to set up the performance team with browser-specific training, or to pull another developer who has more experience with that browser onto the performance team.
Changing Trends over Time
When a small set of issues require lots of back-and-forth to complete, bottlenecks can build up and significantly slow down progress. Paul keeps an open line of communication with the QA team on his project, and tries to clear blockers and keep things moving along. This often means getting development and QA communicating about important issues, but Jira gives Paul new insight into larger trends.
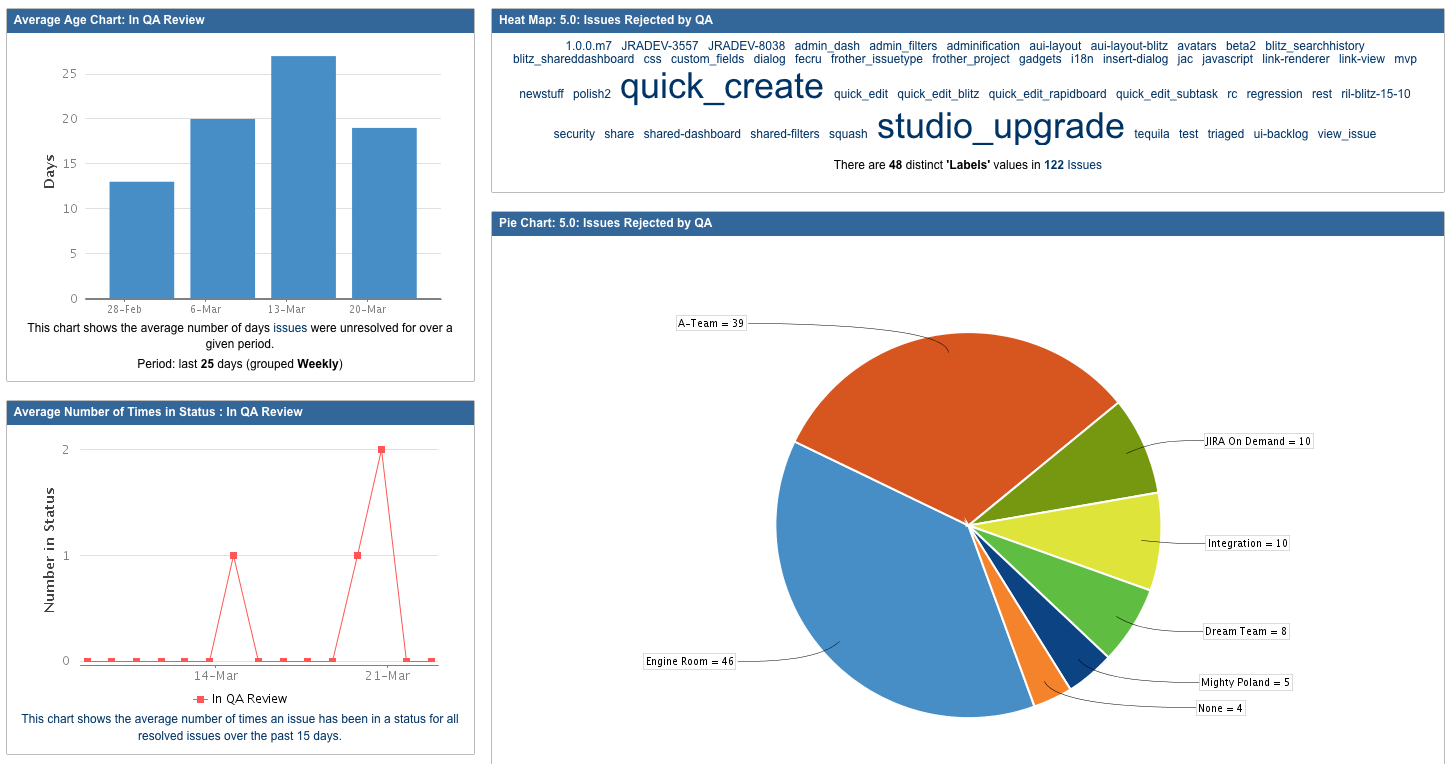
A search for issues that have been rejected by QA can be broken down by team, issue type and component to spot risk areas over time and keep an eye out for changes. A QA dashboard displays this information to the entire development team, so QA can set proper expectations about which issues will need extra scrutiny before verification, and more importantly, the development team has the context to decide which issues to finish up early in the week, and which ones won’t be in the weekend build if they are sent to QA on Friday afternoon.
What’s in Your History?
Your Jira instance is chock full of information just like this, giving you insight into what’s happening today and, more importantly, framing your decisions in the future. Set up charts and dashboards based on change history for quick, easy reference every day, and use these as the basis to recommend changes to your team lead, manager, or even the CEO. Dig into the mine of information and get your software project churning along smoothly: search for change history gold!
Recreate the Queries Above
All the queries above are easy to reproduce in your own Jira instance. Give it a try! Click the Issues tab and switch to the Advanced search mode, which uses JQL (Jira Query Language). Type in the query shown and follow the steps to place it on your dashboard.
All issues escalated in Priority:
priority changed to Blocker
- select ‘charts’ from the Views menu
- choose pie chart
- sort by Reporter
Issues pushed back from one Version to another:
fixVersion changed FROM "Iteration 11" TO "Iteration 12"
- replace “Iteration 11” and “Iteration 12” with the Versions in your project
- add Issue Statistics gadget to your dashboard showing your new filter.
All issues Rejected by QA:
status was "Rejected by QA"
- replace “Rejected by QA” with any status in your instance
- Save as a Filter
- Set up a dashboard with several gadgets: pie chart, issue statistics, time in status, label heat map, etc using that Filter.
Bonus Query!
status was "In Progress" AFTER startOfWeek(-1)
- shows all issues that have been In Progress since the beginning of last week
- JQL lets you use time-based selections like start and end of day, week, month and year. Leave the parenthesis empty () to show start of this week. Set a positive value (1) to show the start of next week.

